HDMI Audio Jitter
HDMI Audio Jitter: Is there a way out?
In the introduction paragraph of the VanityPRO presentation, we briefly mentioned issues associated with digital audio transmission over the HDMI link. To date, there have been many articles produced, covering the topic from very detailed engineering perspective analysing the fine details of the HDMI protocol, to subjective perception of audiophiles slaying HDMI for sounding dull, harsh and with lack of details. The truth is that HDMI is not very popular amongst audiophiles and the general conclusion is that jitter is the culprit.
Dedicated HDMI Audio Output
Many audio enthusiasts are asking, how bad is the HDMI jitter, and is there a way to get rid of it? Well, it seems to be bad enough, so the audio equipment manufacturers started implementing special HDMI output ports just for audio, claiming it is either jitter free or with significantly improved jitter figures. OPPO even published a knowledge base article describing the jitter reduction circuit in their flagship player UDP-205. Let’s have a brief look at it.
https://www.oppodigital.com/KnowledgeBase.aspx?KBID=129&ProdID=UDP-205
The article explains the difficulty of HDMI audio transmission in technical terms – how the audio clocks are generated from the video clocks in a complicated way. Sometimes this is a task that is nearly impossible with certain video resolutions and audio sampling rates. The introduction paragraph is very useful to understand the fundamentals of the HDMI audio jitter issues.
Then a solution is proposed – a fixed video clock suitable for generating audio clocks, blank video data and a high-quality oscillator. The improvement is then presented using two methods. The first one is an eye-diagram measurement of the HDMI video clock, presumably the TMDS link clock. The eye jitter is claimed to drop from circa 53ps down to 50ps, without any further details. The second method uses the J-test audio signal played through the whole chain from the OPPO player to a “lower-end mass market AV processor” over HDMI. The results of the second method are presented as two FFT plots of the resulting analogue signal. The improvement is interpreted as reduction of two sidebands by 15dB.
Discussion
Let’s have a closer look at the results. While the technical solution of a dedicated HDMI port for audio, by basically creating defined conditions for the HDMI audio transmission within the HDMI protocol boundaries, is surely clever and must have taken a lot of engineering effort to implement, the results and the way they are presented seem to be a little problematic, to say the least.
The first thing to note is that jitter as a number of its own without context doesn’t say much technically and virtually nothing about how an audio system is going to sound. To quantify the influence of jitter on digital to analogue audio conversion (that where it comes to play), there needs be a lot more information available – such as the frequency bandwidth of the phase jitter or its actual spectral content, type of jitter, etc. Moreover, the final effect of jitter on perceived sonic performance depends on many other variables, such as modulation type (PCM or DSD), sensitivity of specific DAC chips to different types of jitter and many others.
Method #1
There is a non-trivial relationship between the TMDS clock and the regenerated audio clocks on the receiver side in terms of jitter. Presenting the advantage of the dedicated HDMI audio output using an eye-diagram of the TMDS clock has very little merit. Both presented oscilloscope plots look virtually identical and the declared jitter figure improvement from 53ps down to 50ps is really very small. Without further details about the test equipment used, an assumption can be made that the difference is withing the measurement error.
Method #2
As for the second method, the famous J-test signal was specifically designed as the worst-case scenario of audio data change to quantify the sensitivity of S/PDIF & AES/EBU digital receivers and subsequently individual combinations of receivers and DAC chips (the results are analysed in analogue domain) to data-induced jitter. The clock recovery circuitry (PLL) in digital receivers is usually the most sensitive sub-system when it comes to clock stability. The HDMI transmission protocol is very different from S/PDIF and AES/EBU, and meaningfulness of using J-test signal in OPPO’s test scenario is questionable. The J-test signal might have some influence on dynamic behavior of the internal circuits in the HDMI receiver and its clock recovery due to its very nature, but interpretation of the results would need to very careful. The presented FFT plots “before and after” show generally very noisy analogue signal. It is very difficult to consider the lower sidebands as significant reduction of “audio jitter artifacts” in the presence of massively elevated noise floor which is completely masking the spectral components of the original J-test signal (16-bit J-test assumed). If the poor appearance of the FFT plots is caused mostly by jitter, then the vast majority of jitter energy is in the elevated noise-floor and not in discrete spectral sidebands originating in the J-test signal structure.
Conclusion
The test methods and the results provided by OPPO to demonstrate improvements achieved by the dedicated HDMI audio output are unconvincing. The differences between the standard and the new improved HDMI audio transmission methods seem to be negligible with no real benefit in sonic performance to be expected.
Jitter Origin
There is a great value in the article from OPPO though, and that is the sole fact that the HDMI audio cannot be improved in terms of jitter by a cleverly designed circuit in the HDMI source. HDMI is a complex protocol, and its primary purpose has always been video transmission, not audio. This is why the sonic quality is so much behind the aging S/PDIF and AES/EBU protocols which were designed specifically for audio. The issue of HDMI audio jitter has to be dealt with on the receiver side, where the audio clocks are derived from the high frequency TMDS clock with its own timing characteristics. This is where most of the audio clock jitter is coming from due to use of high bandwidth PLLs with very small jitter rejection abilities.
Instead of trying to clean up the jittery HDMI audio clock, the approach used in the VanityPRO completely discards the regenerated HDMI audio clock to start with. It is only the incoming data rate that determines the nominal sampling frequency. Then our two local high-quality audio oscillators and a clever control algorithm that monitors the audio data buffer utilization migrate the audio data from jittery HDMI domain onto the new audio clock domain with high-stability clocks.
Jitter Measurement
In the previous paragraphs it was discussed that the test methodology used by the OPPO engineers to prove the qualities of their jitter reduction circuit was not optimal. So, is there another way to measure HDMI audio jitter or its effect on analogue audio directly? Well, there seem to be at least two or three options. The first one is just one step further from what OPPO did with their J-test method. As mentioned before, the J-test signal was designed to reveal jitter sensitivity of digital audio receivers in combination with DAC chips. If OPPO engineers had converted the received digital audio to S/PDIF or AES/EBU and used a “lower-end mass market DAC” feeding an audio analyser, the J-test method would be much more valid. Most HDMI receiver chips have direct 1-wire digital audio output (S/PDIF), so this step would be effortless. This way the whole HDMI link with its transmitter and receiver would turn into a signal transmission black box. Only the accumulated effects of such black box could be analysed with the J-test signal via S/PDIF or AES/EBU using a traditional DAC device with “not-so-great” jitter rejection to highlight the differences in input signal quality. The only other thing that needs to be kept in mind is that the J-test results represent the combined effect of the signal quality and the jitter rejection performance of the DAC device.
The second option is to measure the jitter of the S/PDIF or AES/EBU carrier using specialized test equipment. Most of the dedicated audio analysers on the market have the facility to measure the carrier jitter built in and the results are presented visually as a carrier eye-diagram or a peak-to-peak jitter amplitude.
The third option could be using an oscilloscope to analyse the jitter of the digital carrier or the DA conversion (master) clock. With access to the inner circuitry of a HDMI receiver, it should be easy to measure the HDMI interface jitter directly on the regenerated audio clock provided by the HDMI receiver chip. With the audio signal in the S/PDIF or AES/EBU format, any other established method to measure, analyse and quantify jitter of standard digital audio interface can be used. Despite conversion of the HDMI audio into S/PDIF or AES/EBU format in the HDMI receiver, the signal still carries all the timing characteristics of the HDMI interface. Therefore, subsequent jitter analysis of the S/PDIF or AES/EBU signal can provide a very good estimate of the HDMI interface/audio jitter.
VanityPRO Jitter Performance
To demonstrate the effectiveness of the jitter attenuation/clock recovery of the VanityPRO, several jitter measurements were made using different methods. The following equipment was used.
HDMI Signal Source: OPPO UDP-203
HDMI Audio extractors: VanityPRO and Ligawo
USB Audio Interface: Weiss INT204
Stand-alone DAC: SMSL Sanskrit6
TIE Jitter Analyser: Keysight EZJIT
Audio Analyser: Prism Sound M1
J-Test
The first method used is with the HDMI audio converted to S/PDIF format and the J-test signal. The UDP-203 was connected to one the HDMI audio extractors at a time via a 2m HDMI cable. The J-test file was played in FLAC format at 48kHz. The digital audio output from the audio extractor was connected to the SMSL DAC. The analogue output from the DAC was then fed to the single-ended analogue inputs of the audio analyser. Since Prism Sound pioneered the J-test method, the audio analyser has a script available to automatically generate the test signal as well as the results in the convenient form of “J-Test Sidebands + Noise” figure. This takes into account not only the sidebands caused by the data-induced jitter, but also a wideband noise. In addition to the HDMI audio extractors, the native digital audio output from the UDP-203 and a high-quality USB audio interface Weiss INT204 were also tested with J-test signal for comparison.
Ligawo
VanityPRO

OPPO UDP-203
Weiss INT204
Discussion
We will note again that the results discussed here are the combined performance of all the elements in the whole signal chain. The J-test Sidebands+Noise figures attributed to the individual signal sources are also influenced by the DAC used. Reviews of the DAC and its performance can be found online for comparison purposes.
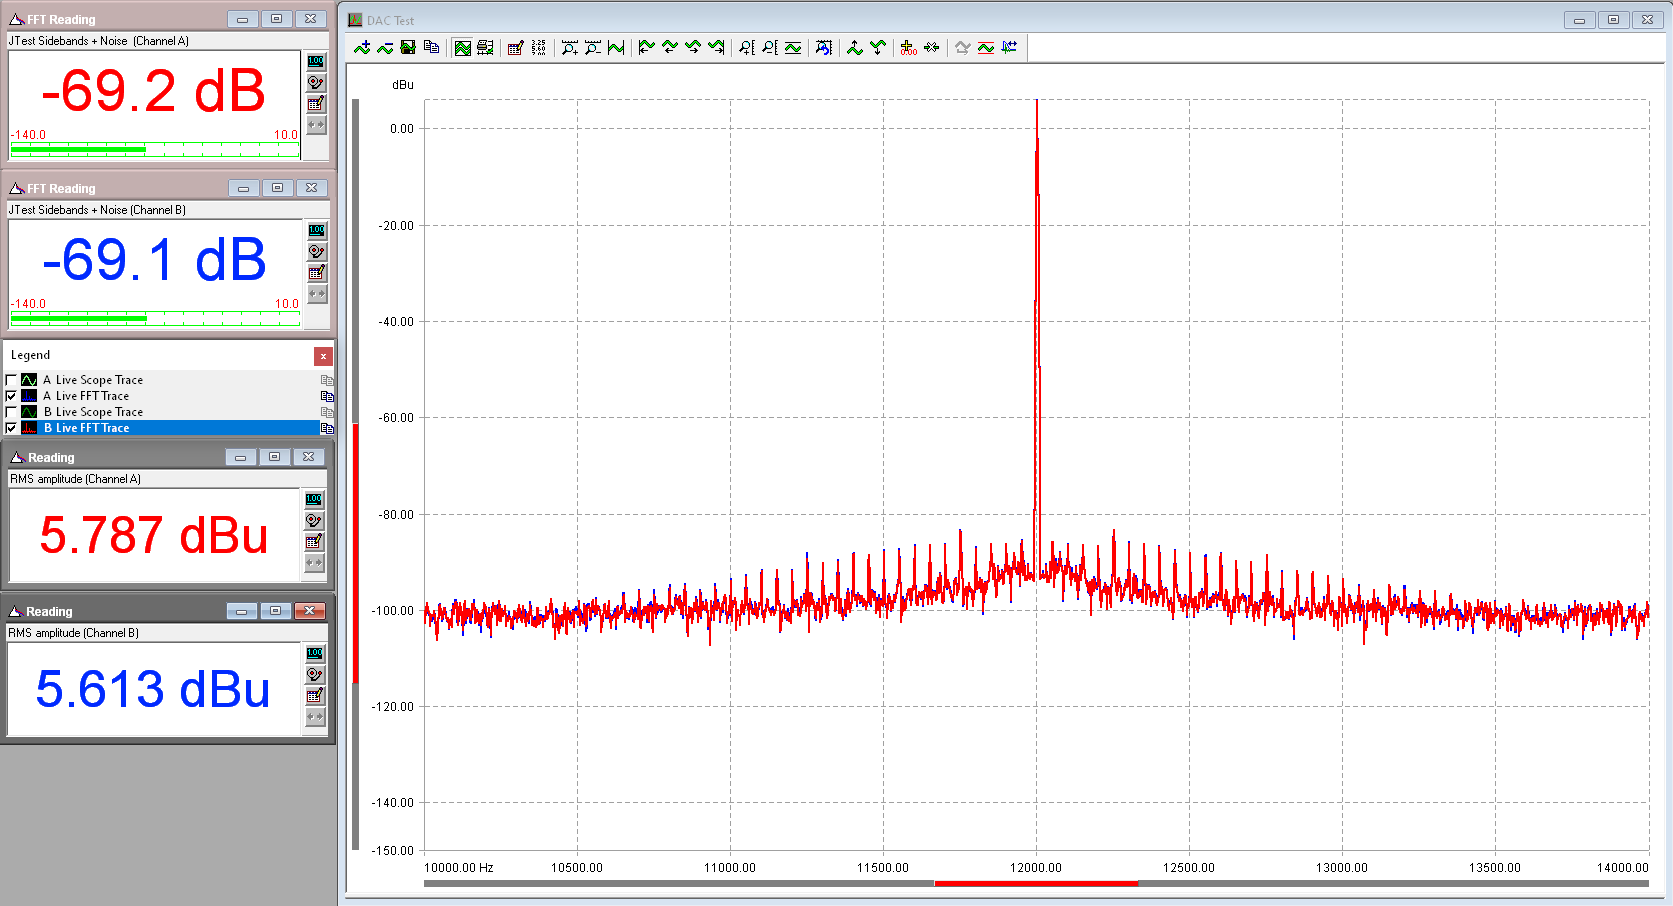
The Ligawo Audio extractor represents raw HDMI Audio performance without any sophisticated jitter attenuation. As expected, the noise-floor is very high with a comb-like shape around the 12kHz audio tone. Considering the other results and raw performance of the DAC, it is safe to assume that majority of the noise is a result of the HDMI jitter. The FFT plots in the OPPO article don’t provide information about the total analogue signal level, so direct comparison of the noise-floor levels is not possible, despite the unit conversion between dBu and dBV being trivial. The J-test sideband+Noise figures are -69.1dB and -69.2dB for left and right channel.
The FFT plots for the VanityPRO show the noise floor at the same level as the DAC’s own, with just a tiny skirt around the main 12kHz tone. The data-induced sidebands are the only sign of performance degradation due to jitter, proving that the VanityPRO is an exceptionally clean digital audio source. The J-test sideband+Noise figures are -90.7dB and -90.4dB for left and right channel, which is better by more than 21dB than the Ligawo. If a DAC with better data-jitter rejection was used, the difference in performance would be even bigger.
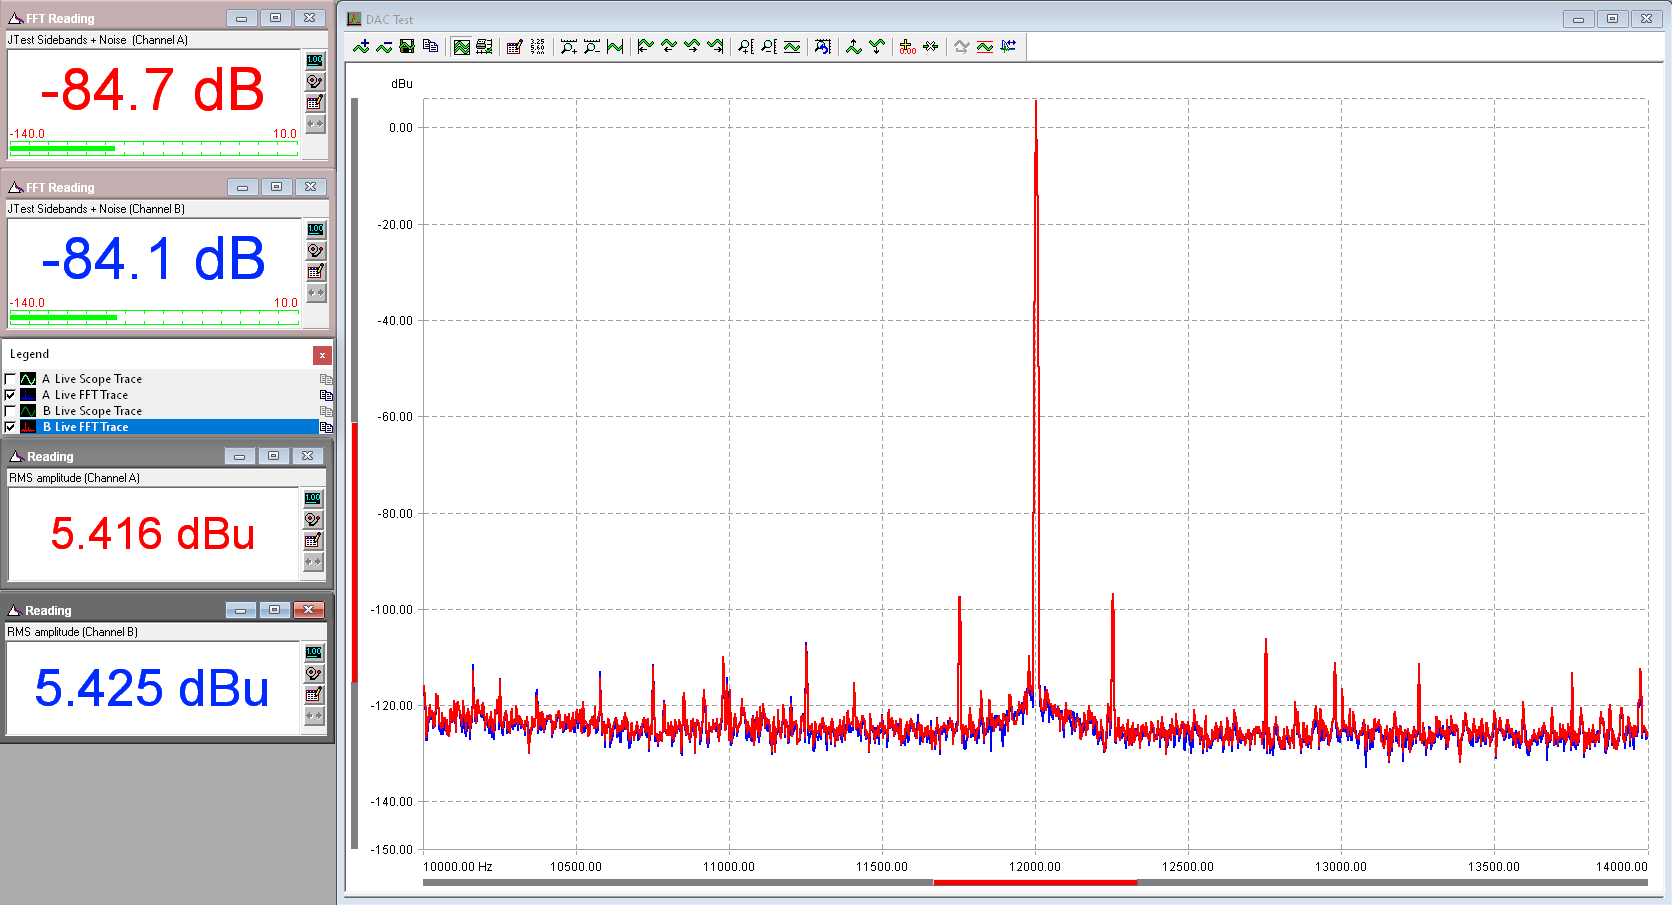
The native digital output from OPPO UDP-203 was expected to provide very clean signal, comparable in performance to the VanityPRO. Surprisingly, it seems to be burdened by a fair amount of jitter as well, causing elevated noise-floor and non-harmonic spurs. The J-test sideband+Noise figures are -84.7dB and -84.1dB for left and right channel, which is significantly worse than the VanityPRO.
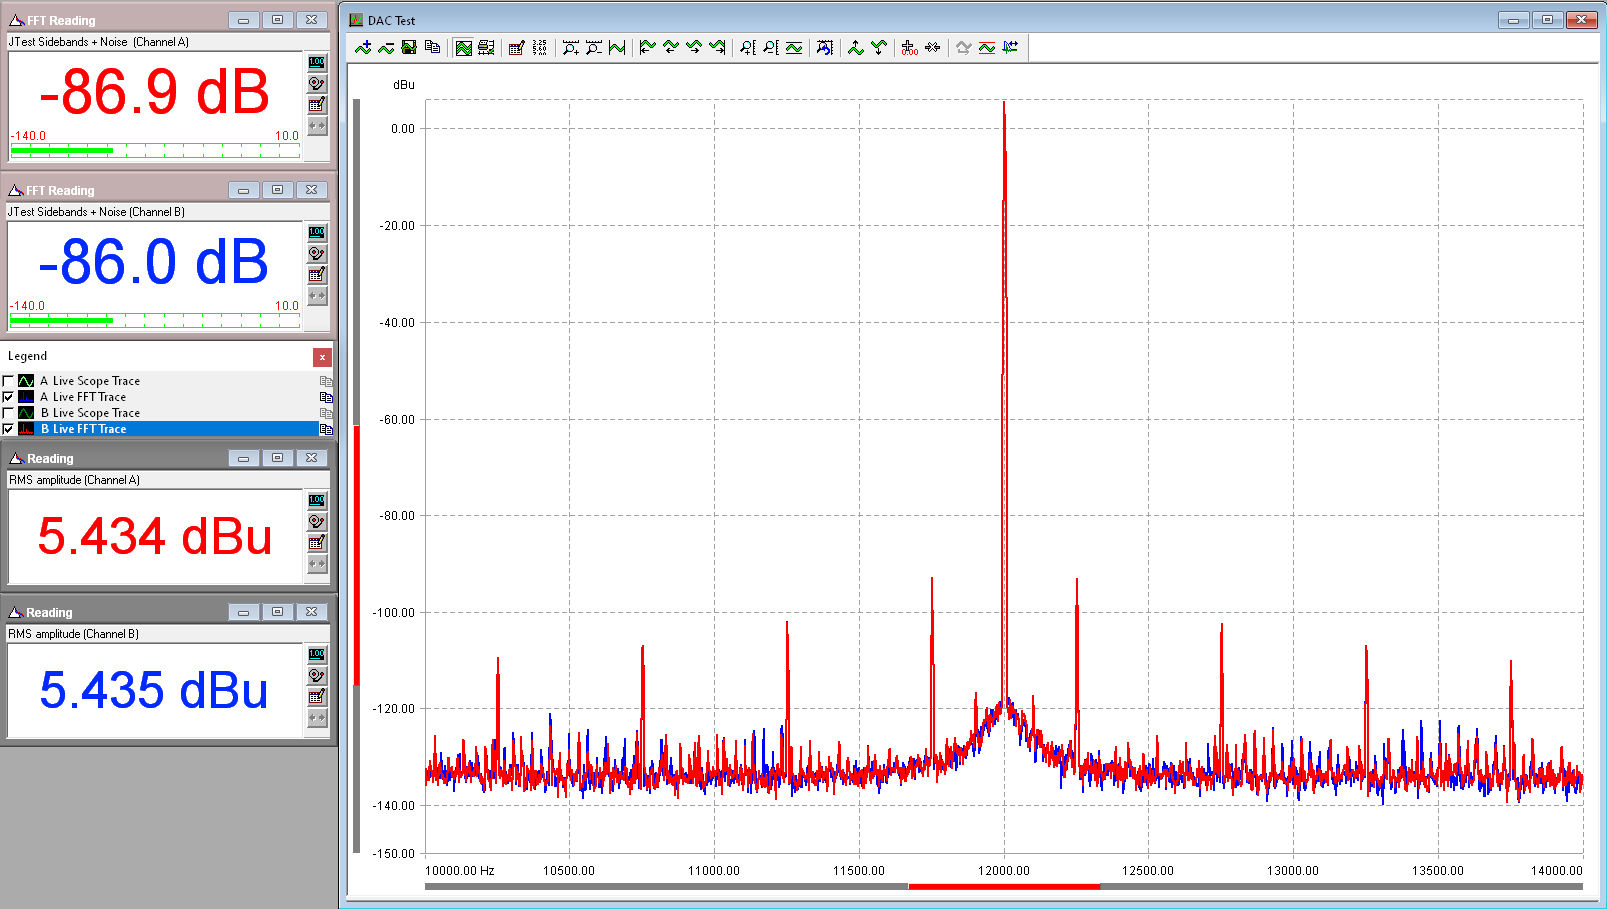
The last device tested was the INT204 from Weiss Engineering. It is a high-quality USB audio interface with fixed audio oscillators, which should produce very stable output signal. The performance was slightly better than the OPPO UDP-203 with the J-test sideband+Noise figures of -86.9dB and -86.0dB for left and right channel. The noise-floor was close to the DAC’s own noise, but there was a fair amount of low level non-harmonic spurs present. Those spurs might be caused by noise leakage through the USB bus from electromagnetically very noisy environment of a PC or by the USB interface itself.
Summary
Device | J-test SB+N [dB] Left | J-test SB+N [dB] Right |
| Ligawo | -69.2 | -69.1 |
| VanityPRO | -90.7 | -90.4 |
| OPPO UDP-203 | -84.7 | -84.1 |
| Weiss INT204 | -86.9 | -86.0 |
Digital Carrier Analysis
The next method used was the digital carrier jitter analysis of the S/PDIF signal performed directly by the Prism Sound analyser. The output of this method is the “Sampling Jitter” figure in nano seconds peak to peak (ns p-p). The advantage of this method is that it also allows to demodulate the sampling jitter and show its spectrum in the audio band. The same collection of devices was used and the S/PDIF signal was connected directly to the Prism Sound analyser. The measurements were taken with J-test signal to create worst case data transfer scenario.
Ligawo
VanityPRO
OPPO UDP-203
Weiss INT204

Discussion
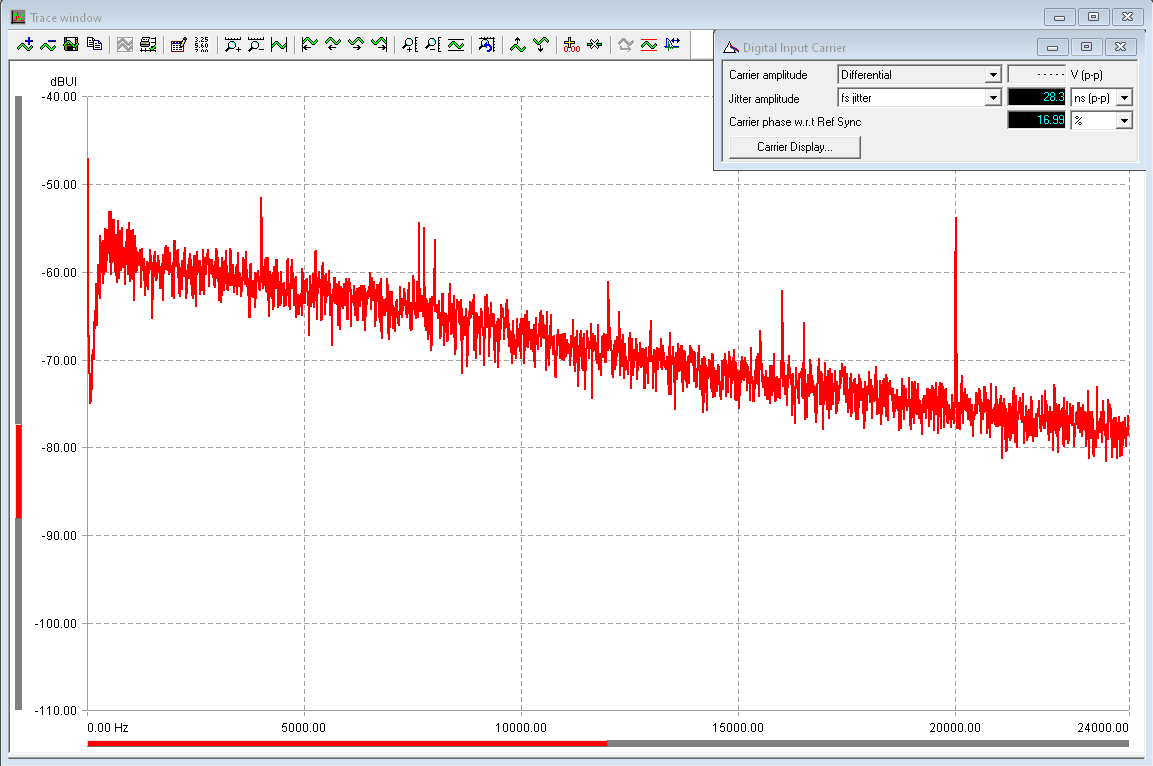
The Ligawo HDMI extractor showed 28.3ns p-p of sampling jitter and jitter spectrum with high level of uniform noise and a discrete peak at 20kHz.
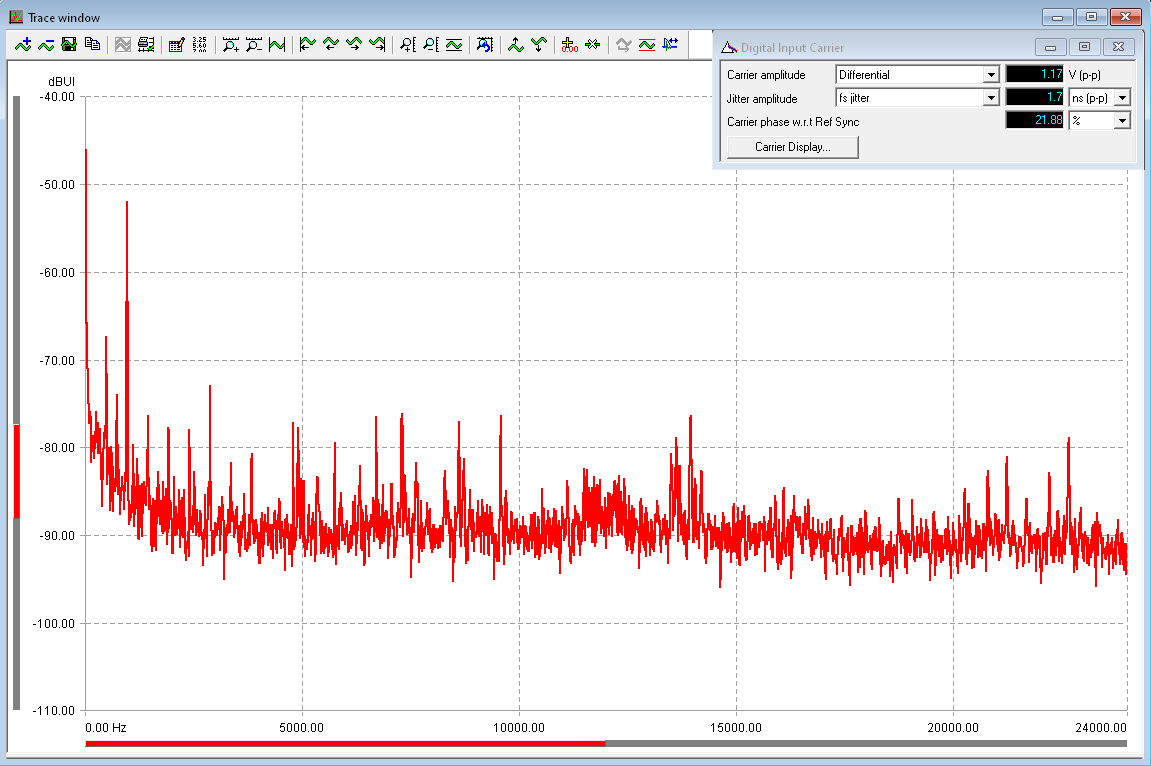
The VanityPRO had 1.7ns p-p sampling jitter and jitter spectrum with much lower noise-floor with some low-frequency discrete components. Those components were present at the same level even with no audio signal transferred. Their presence in measurements of other devices may indicate limit of the test method or some system related origin.
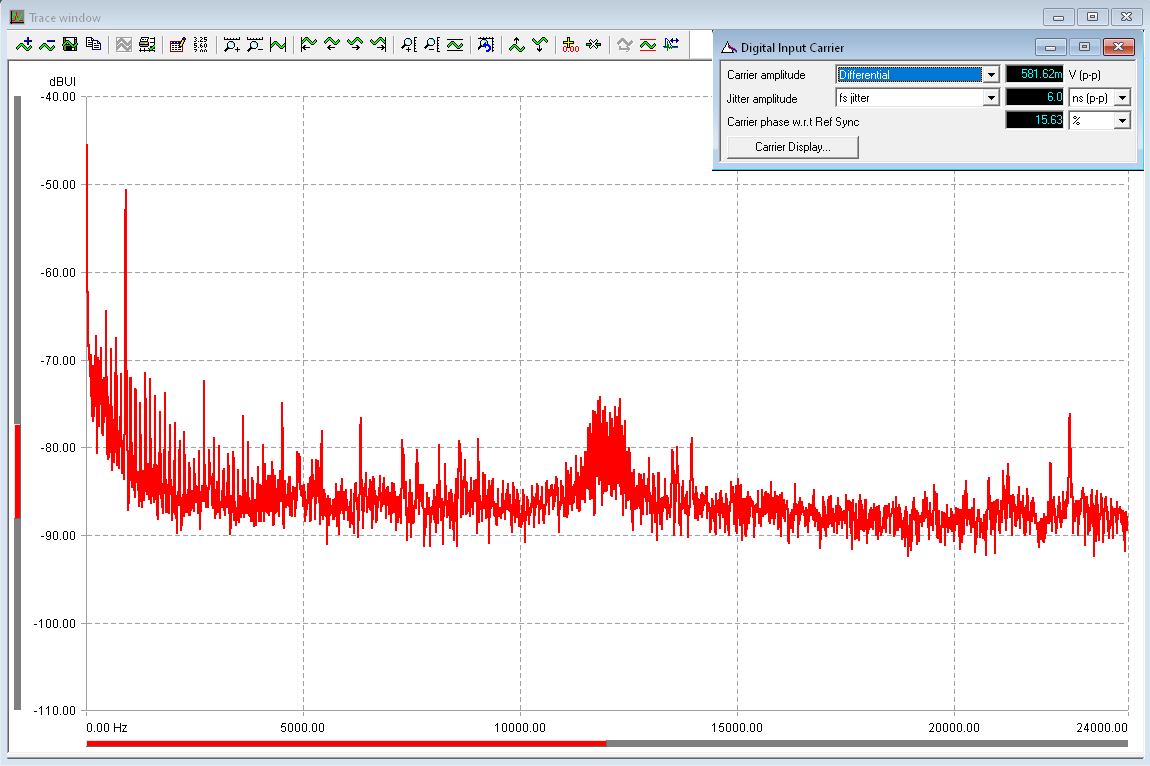
The OPPO UDP-203 showed 6.0ns p-p sampling jitter and slightly elevated noise-floor with a little bump around 12kHz, possibly due to the J-test signal.
Finally, the Weiss INT204 had 8.0ns p-p sampling jitter with demodulated jitter noise-floor similar to the VanityPRO, but with higher level of low-frequency components.
Again, the VanityPRO demonstrated the lowest amplitude of sampling jitter in the digital carrier analysis performed by the Prism Sound audio analyser.
Summary
Device | Jitter Amplitude [ns p-p] |
| Ligawo | 28.3 |
| VanityPRO | 1.7 |
| OPPO UDP-203 | 6.0 |
| Weiss INT204 | 8.0 |
Master-Clock TIE Analysis
The last method used to compare the jitter levels between a standard HDMI receiver and the VanityPRO is the direct audio master clock analysis by a specialized tool from Keysight. In this case, the audio master-clock provided by the HDMI receiver chip is analysed for TIE (Time Interval Error) and compared to TIE of the audio master-clock of the VanityPRO. This comparison objectively quantifies the HDMI audio jitter and the improvement in audio clock quality achieved by the VanityPRO.
TIE is an accumulated edge timing error of the real clock signal versus an ideal clock representation with the same frequency. The momentary measurements are accumulated and displayed as a histogram with statistically determined parameters. Definition of TIE and standard measurement methods can be found online.
HDMI Receiver
VanityPRO
Discussion
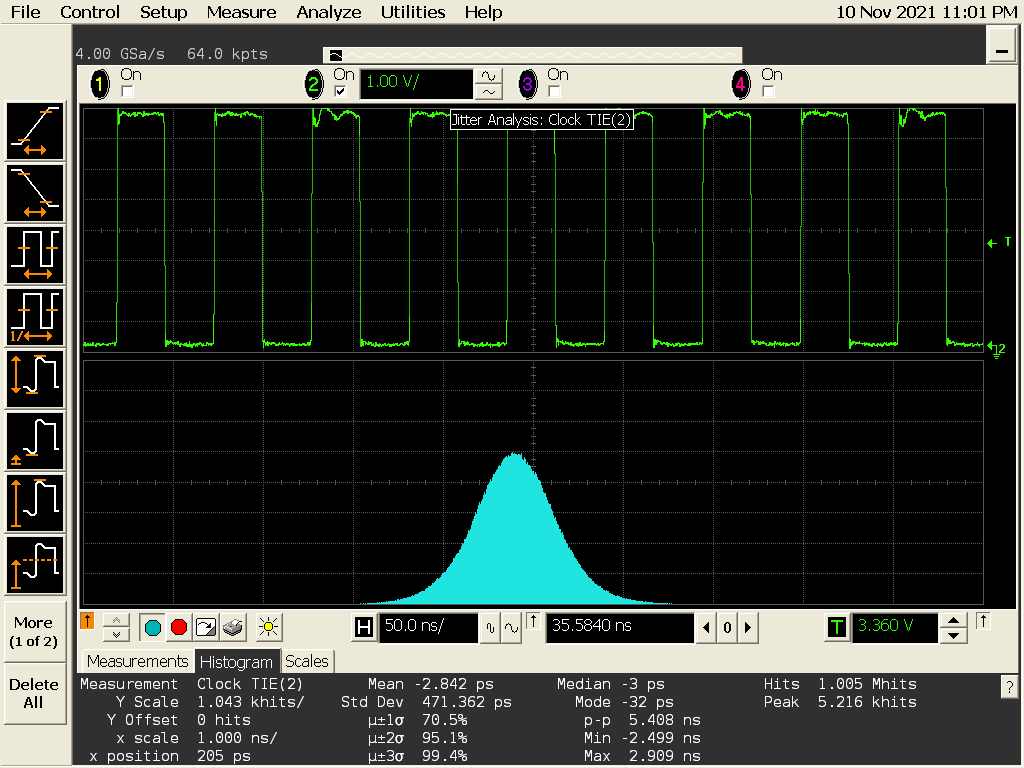
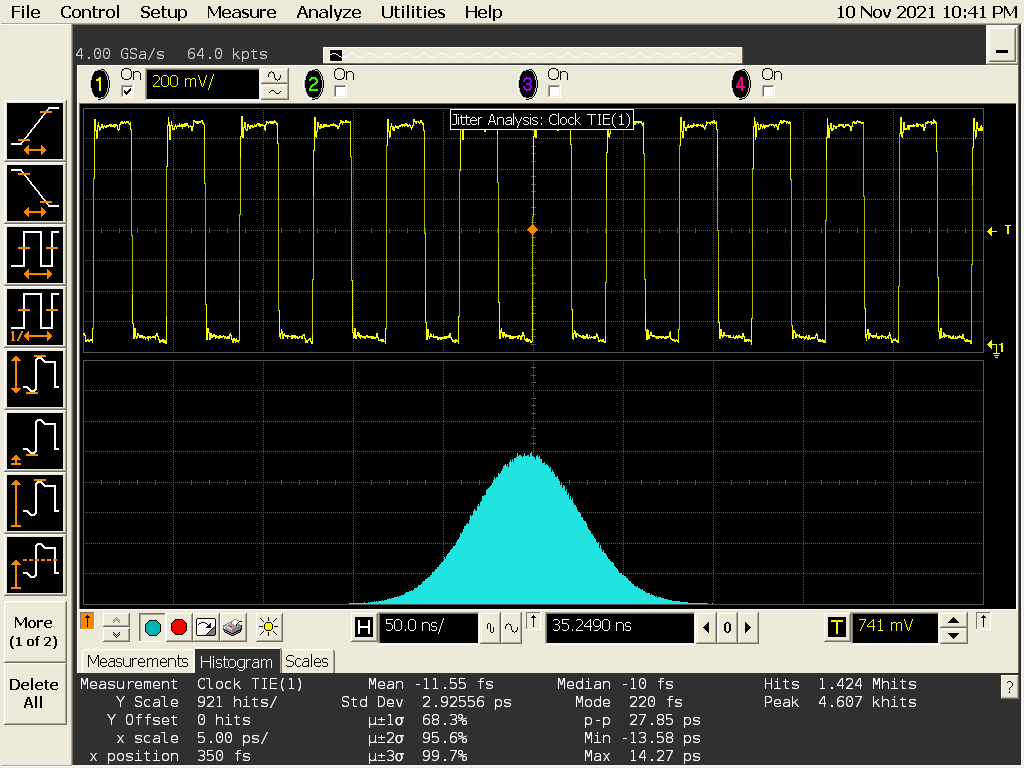
The values to look at in the TIE measurements are Standard Deviation and peak-to peak (or Min and Max). The Standard Deviation represents an RMS value. One thing to note is that both histograms exhibit standard Gaussian distribution. The HDMI receiver gives TIE Standard deviation (RMS) 471ps while the VanityPRO has only 2.9ps. This is a ratio of circa 162x or 44dB in favor of the VanityPRO.
Summary
Clock Source | TIE RMS [ps] | TIE p-p [ps] |
| HDMI Receiver | 471.3 | 5408 |
| VanityPRO | 2.9 | 27.8 |
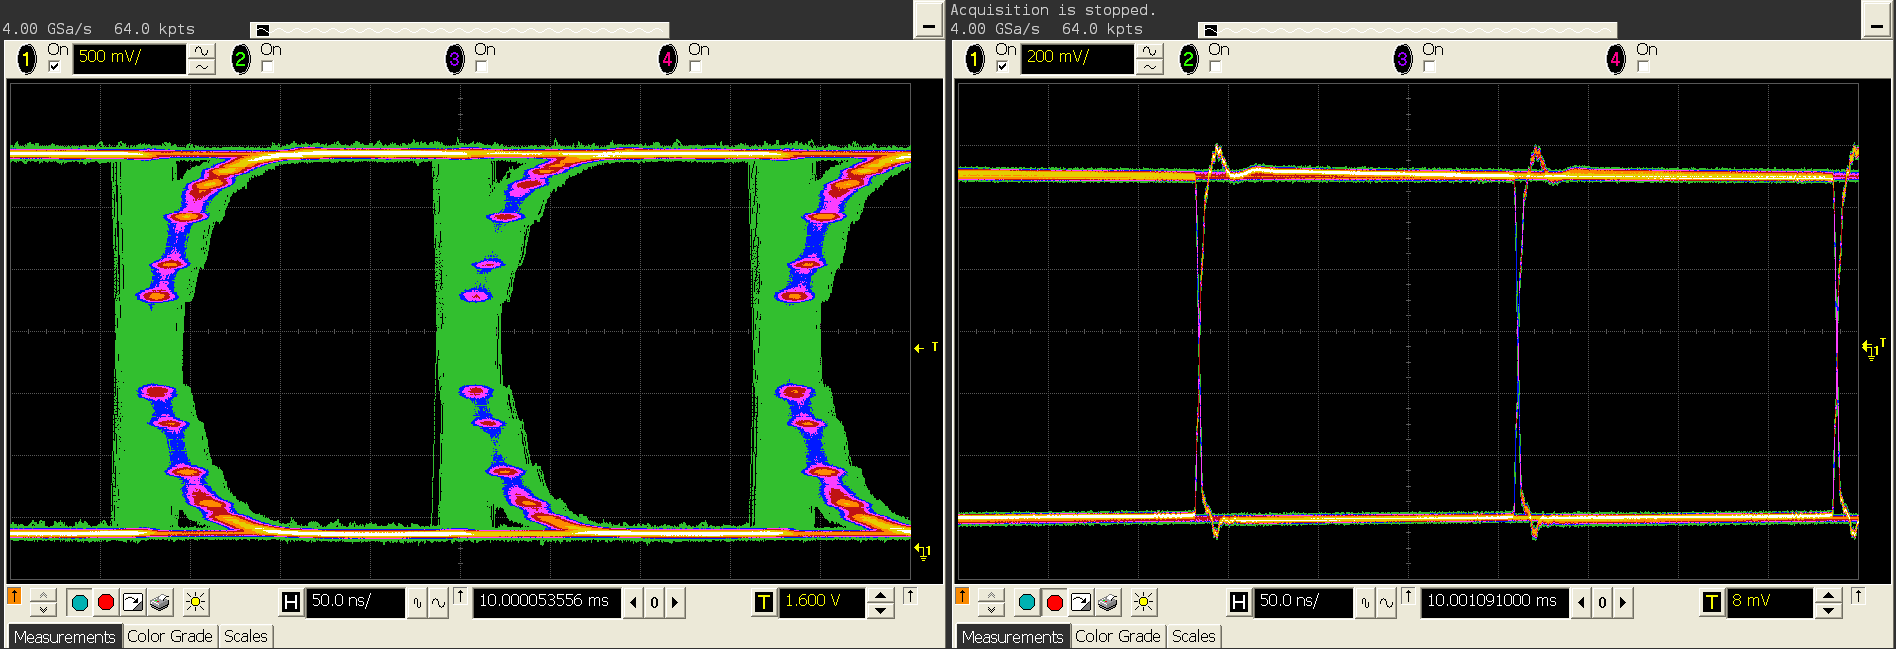
Another way to visualize the TIE measurement is with oscilloscope display persistence and delayed horizontal line. Edge instability from trigger to the observation point accumulates over an arbitrary number of clock periods and causes color-graded thickening of the displayed waveform. This visualization method is used in the VanityPRO online presentation of the jitter attenuation functionality.
HDMI Receiver versus VanityPRO
Conclusion
This purpose of this article was to cover the topic of HDMI Audio jitter in the context of quantifying the jitter levels using various methods and demonstrating the jitter reduction capabilities of the VanityPRO HDMI audio extractor. The results of direct and indirect methods of jitter measurement presented in this article prove that the VanityPRO offers unparalleled performance in jitter elimination from the HDMI interface. This gives the audio enthusiast a unique opportunity to use any compatible HDMI audio source as a top-tier digital multi-channel audio transport with bit-accurate digital audio transmission and virtually zero jitter for most accurate audio reproduction.
The PDF version of the article is available in the Downloads section or in this link: